relevancia
estadística y predictiva. Las variables que incrementan la confianza en un
banco están relacionadas con una mayor tasa de alfabetización financiera,
mejores estrategias de diversificación del riesgo, mayores ingresos per cápita
por hogar, así como la proximidad a los bancos. La edad y el acceso a internet
también son variables importantes para dichas evaluaciones. El modelo CatBoost presenta un valor AUC robusto para la recuperación
de la precisión de 0.734. El estudio propuesto contribuye a dos objetivos
principales diferentes: (i) la aplicación de una combinación de modelos
econométricos con algoritmos modernos de aprendizaje automático.
Keywords:
confianza en los bancos; inclusión financiera; aprendizaje automático; métodos
de encuesta; México.
JEL: G21;
D14; O16; C55; C25
Introduction
This research examines the
determinants of trust in banks (TIB) in Mexico using individual‐level data from the National Survey of Financial
Inclusion (ENIF)’s 2021 and 2024 waves. This study’s major research question
is: "What predicts TIB among Mexican adults?" When depositors trust
that banks will safeguard their deposits and honor commitments, the cost of
transactions is low and the markets of credit and savings are more efficient (Knack & Zak, 2003). From a socio‐psychological perspective, trust itself denotes
voluntary vulnerability based on positive beliefs about a counterparty’s
ability and kindness (Hu et al., 2019). Applied to the context of banking, this refers to
depositor confidence regarding intermediaries to behave responsibly and
truthfully, thereby encouraging participation in formal financial services (Ahmad et al., 2021).
In addition to individual
characteristics, our empirical framework includes state-level infrastructure
measures (ATMs, branches, TPOS-equipped establishments) and INEGI’s Safety
perception index as higher-level controls. To compare
machine learning classifiers to standard estimates of the logistic regression
model. While our analysis will take into consideration state-specific
infrastructure measures, the direct relationship between micro-trust metrics
and national aggregates is a topic for future research. ENIF 2021-2024 offers
micro-data for the six regions in Mexico. In consideration of the disparate
confidence level that the public may have toward the financial system, our
analysis will focus on the variation of Trust in Banking (TIB) for individual
conditions. Persistent distrust is a barrier; this study identifies which
attributes and contexts predict trust to safeguard deposits and honor
obligations.
The aim of this study is twofold. First, it aims to
determine which individual, and contextual factors have the largest bearing on TIB
among Mexican adults. Second, it endeavors to estimate the contribution of
banking infrastructure and digital service provision to confidence using
machine-learning algorithms (Chen & Guestrin, 2016) for prediction and logistic regression for
inferential work.
We hypothesized here that greater financial capability—more financial knowledge and more disciplined
money-management practices—would be accompanied by greater TIB. We also posited
that access to the internet and smartphones (digital inclusion) and usage of
internet/mobile banking, along with denser local financial infrastructure
(branches, ATMs, and point-of-sale terminals), would each positively correlate
with TIB. We predicted a positive correlation of perceived neighborhood
security with TIB and lower TIB in less safe local conditions. For
demographics, we predicted a positive effect of education and income to
increase TIB and a nonlinear (inverted-U) effect of age. We finally predicted
risk attitudes consistent with contemporary portfolio theory—understanding the
risk–return trade-off and support of diversification—to forecast TIB and
investigated whether the mean TIB is different from 2021 to 2024 levels
conditioning upon covariates.
Consistent with these expectations, our empirical
analysis reveals that infrastructural and digital‐access variables are the strongest predictors of
depositor confidence. In logistic regression, a one‐unit increase in digital‐access (smartphone ownership and household internet
availability) raises the probability of trusting banks (TIB = 1) by approximately
8 percentage points (pp) (p < .001), with branch-network availability
showing a positive marginal effect on TIB, whereas normalized ATM density
exhibits a statistically significant negative marginal effect. These results
highlight the usefulness of combining machine learning with classical
econometric approach to analyze emerging markets.
These findings highlight the usefulness of combining nonlinear machine learning
with classical methods to analyze trust in emerging markets. 2. Literature
Review Trust in financial institutions is essential to financial inclusion and
the efficient functioning of banking systems.
This work, through the inclusion of granular
constructs for trust and national infrastructure metrics, has a number of contributions to make to literature and policy.
This work advances theories about institutional forms of trust that show how
physical and virtual banking infrastructure complement each other and encourage
deposits and applies machine learning for accuracy and conformity with policy
relevance.
Literature Review
Trust in financial institutions is essential
to financial inclusion and the efficient functioning of banking systems. A
broad international literature point that higher levels of institutional trust
are positively associated with bank account ownership, the use of formal
financial services, and overall financial stability (Fungáčová et al., 2019). In emerging economies with
greater informality and uncertain institutions, trust is crucial for
individuals' participation in the formal financial sector.
From an institutional perspective, past
research emphasize regulation, banking supervision,
and deposit‐insurance
schemes as mechanisms that reduce uncertainty and promote systemic trust (Knell & Stix, 2015). However, further studies indicate that the perceived
credibility on these warrants among depositors are
just as important as their effectiveness (Butzbach, 2016). Therefore, poor enforcement, limited transparency,
or low awareness of consumer protections may undermine trust even in the
presence of formal safeguards.
More over, evidence from empirical research suggests that trust in banks
is a multidimensional construct shaped by economic,
social, and psychological factors. Mayer, Davis, and Schoorman
(Mayer et al., 2006) propose a framework to understand
organizational trust, which comprehends three key dimensions: ability,
benevolence, and integrity. This framework has been widely applied to financial
institutions. A research by Cruijsen,
de Haan, and Roerink
(van der Cruijsen et al., 2021), employing European survey data, shows that higher
levels of financial knowledge are associated with greater trust in banks and
financial authorities. In contrast, negative personal experiences with
financial institutions tend to wear away trust in a persistent manner.
Recent studies have highlighted the
growing relevance of digital financial inclusion to physical banking
infrastructure in influencing levels of trust in financial institutions. For
example, banking trust could be boosted by improved digital safety as well as
improved service quality and handling of client data (Bijlsma et al., 2022). On the other hand, adoption in technology cannot
guarantee improved trust if concerns in these two areas still linger (Koomson et al., 2023). Similarly, physical bank branches often function as
“symbols of trust,” although their marginal importance may decline as digital
channels expand (Sakong & Zentefis, 2024).
Contextual conditions, especially
perceived public security, is another factor that plays a significant role in
shaping institutional trust. In the Mexican context, Blanco (2013), who analyzed the impact of insecurity and crime
victimization on support and satisfaction in institutions, shows that lower
trust in public and financial institutions are
associated with higher levels of crime and insecurity. This finding concurs
with comparative evidence suggesting that local insecurity operates as an
indirect channel through which confidence in banks and other formal
institutions is weakened (Broekhoff et al., 2024).
Scholarship in methodology views
machine learning as a way to improve empirical
economics by increasing the precision of prediction and simplifying complex
problems, thus complementing other methods instead of displacing them,
especially in policy studies ((Mullainathan & Spiess, 2017). Nonetheless, the literature overlooks the strength
of hybrids that combine machine learning methods with causal inference.
More recent studies have used
machine learning algorithms for analyzing trust in banks, proposing that trust
in banks cannot be fully explained using econometric analysis, due to possible
nonlinearities or interaction patterns (Adamyk et al., 2019). Based on World Values Survey data, using an
integrated approach combining both econometric tools and machine learning
algorithms, Adamyk et al. (2019) analyzed how
different factors interact to influence trust in banks. The study confirms that
individual properties and global trust have proved to play an important role in
forming trust in banks. Forecasting approaches will provide enhanced
effectiveness if they are theoretically informed and integrated with techniques
for improved clarity.
However
critical these advances have been, the literature that applies them to Mexico
is very limited, especially in the area of nationally
representative surveys using machine learning tools and theories of trust. The
National Financial Inclusion Surveys carried out in Mexico in 2021 and 2024
present a unique opportunity to close the gap, since these surveys include
comprehensive information on financial behavior, feelings of security,
availability of financial infrastructure, and opinions. The goal of the current
research work is to perform a comprehensive study on the determinants of trust
in banks using the aforementioned tools, with direct
policy implications regarding financial inclusion in Mexico.
Empirical
evidence on determinants of trust in banks
Prior studies link higher financial knowledge to
greater trust in banks, with similar patterns for broader financial
institutions—supporting the view that knowledge and disciplined money
management raise TIB (van der Cruijsen et al., 2021). Digital
access and use tend to complement trust when security and reliability are
credible; during COVID-19, trust in banks’ payment services rose alongside
digital payments, but mere uptake without security/UX improvements does not
necessarily increase trust (Jafri et al., 2024). Physical presence also matters:
branches act as “symbols of trust,” and branch/ATM density is associated with
inclusion and service confidence (Sakong & Zentefis, 2024). In Mexico and the region, perceived insecurity
depresses institutional trust, implying higher TIB where neighborhood security
is stronger(Blanco, 2013).
Trust generally increases with income and follows
mixed, life-cycle patterns by education and age; attitudes aligned with the
risk–return trade-off and diversification correlate with higher confidence in
financial services (Fungáčová & Weill, 2019;
Jafri et al., 2024). Historically, a sizable share of unbanked adults in Mexico
cited lack of trust as a barrier, while recent waves emphasize income/need;
accordingly, we model TIB jointly with digital inclusion, financial
infrastructure, and perceived security to capture the main channels through
which confidence is formed.
Theoretical Framework
Trust
in banking rests on a firm belief that institutions will safeguard assets,
honor commitments, and act with integrity (Mayer et al., 2006). This belief is shaped by three core dimensions—
technical competence, benevolence toward depositors, and adherence to ethical
norms—which together determine depositor confidence in both individual banks
and the broader financial system (Butzbach, 2016).
Formal
structures such as regulation, deposit insurance, and supervisory oversight
provide
“Structural
assurances” that reduce uncertainty and reinforce institutional trust (Zucker, 1986). At the same time, sociological perspectives remind us of that trust functions as a shortcut under uncertainty,
relying on reputational signals and probabilistic judgments in the absence of
complete information (Luhmann, 2018).
Within
Mexico’s financial landscape, depositor trust emerges from judgments about a
bank’s solvency and fairness, filtered through cultural norms and moral beliefs
(Alraheb et al., 2019). Confidence is forged both through formal
channels—such as CNBV oversight and IPAB insurance—and informal influences like
branch reputation and community word‐of‐mouth,
reflecting the coexistence of traditional banking, rural microfinance, and
digital platforms.
Analyzing financial behavior requires understanding
the interplay between personalized trust, developed through repeated
interactions, and systemic trust, based on market protection and stability.
Pooled cross-sectional ENIF data (2021 and 2024) offers insights into the
factors influencing bank choices.
Methodology
Data Sources and Sample
We use the 2021 and
2024 waves of Mexico’s ENIF, conducted by CONAIF and collected by INEGI. ENIF
is a nationally representative household survey covering financial behaviors,
perceptions, and access/infrastructure in urban and rural areas. A stratified,
multistage cluster design ensures national and regional representativeness;
across both waves 30,548 households were surveyed (15,291 in 2021; 15,257 in
2024), with oversampling of small localities (<2,500 inhabitants). Response
rates were 91% (2021) and 90.5% (2024). After standard cleaning (listwise
deletion and removal of incomplete records), the final analytic sample is
27,056 adults—13,554 (2021) and 13,502 (2024). Both waves had INEGI Ethics
Committee approval, complied with Mexico’s data-protection law, obtained
informed consent, and were released in anonymized form.
Variable Construction
Dependent Variable: Trust in Banks (TIB)
Following Sztompka’s (Sztompka, 1999) “Reflected
Trustworthiness” framework, we operationalize TIB as a composite of five binary
indicators embedded in Section 11 of ENIF (“Confianza
y protección”) (INEGI, 2022). Respondents
answered “Sí” (Salazar-Cruz
& Román-Reyes) (1) or “No” (2) to
each of the following statements:
1. P11_1_1. “Si tuviera
que solicitar servicios de un banco… ¿considera que recibiría toda la
información necesaria?” (Trust that the bank will
provide complete information)
2. P11_1_2. “…
¿considera que resolverían su necesidad o problema económico?” (Trust that the bank will
resolve its economic needs/problems)
3. P11_1_3. “…
¿considera que estaría seguro su dinero?” (Trust that the bank will
keep funds safe)
4. P11_1_4. “…
¿considera que resolverían sus quejas y reclamaciones?” (Trust that the bank will
handle complaints)
5.
P11_1_5. “… ¿considera que protegerían sus datos personales?” (Trust that the bank will protect personal
data)
Each
item (P11_1_1 – P11_1_5) was recoded as a binary indicator (1 = “Sí”; 0 = “No”; missing if “No sabe/No contestó”).
A summative index (TRUST_SUM) was constructed as the sum of these five dummies,
yielding a discrete scale ranging from zero (no trust in any dimension) to five
(full trust on all five dimensions). For models requiring a continuous input,
we also compute a normalized average (TIB = TRUST_SUM / 5), which ranges from 0
to 1.
The
TIB index draws on items that directly map onto the trust dimensions proposed
by Mayer et al. (2006): two items capture
ability (e.g., technical competence of banks and perceived security of
deposits), two assess benevolence (e.g., banks’ concern for customer welfare
and fairness in fee practices), and one reflects integrity (e.g., transparency
in communication and adherence to ethical standards).
Key Predictors
Financial
knowledge, behavior, and attitudes (measurement framework)
We
measure financial capability in components to preserve construct validity and
2021–2024 comparability. Knowledge is an ENIF 5-item index (interest/inflation)
common to both waves—not the Lusardi–Mitchell “Big Three,” which requires a
diversification-knowledge item absent in ENIF(Lusardi & Mitchell, 2011). Behavior is
captured by a Financial Accountability Index (budgeting/record-keeping) aligned
with OECD-INFE (Atkinson &
Messy, 2012). Attitudes
(risk–return recognition; preference for diversification) enter as separate
controls; we therefore do not form a 2024-only OECD composite.
Financial
knowledge (ENIF 5-item). We construct a
financial knowledge index from five factual items on interest and inflation
available in ENIF-2021 and ENIF-2024 (INEGI, 2022; 2025). This ENIF-based
measure is not the Lusardi & Mitchell “Big Three,” which includes a
diversification-knowledge item that ENIF does not provide consistently across
waves (Lusardi & Mitchell, 2011). Four items originate from Section 12
(interest calculations and inflation adjustment), and one item originates from
Section 4.7 (inflation definition). Each indicator is coded as 1 if the
respondent’s answer is correct, and 0 otherwise, as follows:
1.
Inflation Definition (P4_7_1) (INEGI, 2022): Respondents
evaluate whether “Inflation means that the price of things increases”. A
correct response (code 1, “True”) was coded as fknowledge_inflation
= 1; any other response (codes 2, 8, 9) was coded as 0.
2.
Simple Interest (P13_1) (INEGI, 2022), (P12_1) (INEGI, 2025): Respondents answer
the question, “If you lend 25 pesos to a friend and the next week they
return the 25 pesos, how much did you pay in interest?” The correct answer
(“Nothing,” code 1) was coded as fknowledge_interest_simple
= 1; any other response (codes 2–4, 9x) was coded as 0.
3.
Annual Interest(P13_2) (INEGI, 2022), (P12_2) (INEGI, 2025): Respondents
evaluate “Let's suppose that you deposit 100 pesos in a savings account that
gives 2% a year, without deposits or withdrawals, how much will you have at the
end of the year?” The correct answer (“102 pesos,” code 2) was coded as fknowledge_interest_annual = 1; all other codes were coded
as 0.
4.
Compound Interest (P13_3) (INEGI, 2022), (P12_3) (INEGI, 2025): Respondents
evaluate “If you deposit 100 pesos reinvesting the interest, what will you
have at the end of five years?” The correct answer (“110 pesos,” code 2,
since 100 × (1.02)^5 ≈ 110.41) is coded as fknowledge_compound = 1; all other codes are coded as 0.
5.
Inflation‑Adjusted Value
(P13_4) (INEGI, 2022), (P12_4) (INEGI, 2025): Respondents
evaluate “If you are given 1,000 pesos but you have to wait a year with
inflation of 5%, could you buy the same?” The correct answer (“No,” code 2)
was coded as fknowledge_inflation_corrected = 1; all
other responses (codes 1, 3, 4, 9x) were coded as 0.
Subsequently, these five binary variables are
summed to create a composite financial knowledge score (fknowledge_score),
such that fknowledge_score ∈ {0, 1, 2, 3, 4, 5}:

This raw score was then normalized to a
continuous index (Financial Knowledge Index) bounded
between zero and one, defined as:
![]()
Higher values of Financial
Knowledge Index correspond to greater overall financial‑knowledge proficiency.
Financial
accountability index. Coded as Financial Accountability Index we operationalize financial accountability as a composite measure of
six core budget- and expense-tracking behaviors, all drawn from ENIF (INEGI,
2022, 2025) survey items P4_1 and P4_2 sub-questions. For each
respondent i, we define the binary indicators
as follows:
1. budg_recordᵢ = 1 if respondent “maintains a written record of
income and expenses” (P4_1=1);
2. exp_noteᵢ = 1 if they “annotate expenses” (P4_2_1=1);
3. sep_fundsᵢ = 1 if they “separate payment funds from daily
spending” (P4_2_2=1);
4. rec_notesᵢ = 1 if they “track receipts/debts to avoid missed
payments” (P4_2_3=1);
5. mgmt_appᵢ = 1 if they “use an app or tool for expense tracking”
(P4_2_4=1);
6. autopayᵢ = 1 if they “have automatic (domiciled) bill
payments” (P4_2_5=1).
These six indicators are summed to yield a financial accountability score,
and ranges from 0 (no behaviors) to 6 (all behaviors).
We then normalized this value to a 0–1 index.
![]()
This index captures the extent to which each
respondent actively monitors and manages their personal finances. In OECD-INFE
terminology, this index corresponds to the behavior pillar and is modeled
separately from knowledge and attitudes (Atkinson & Messy, 2012).
Risks. Attitudes
(risk perceptions). In line with Lusardi & Mitchell (2011) and OECD-INFE
guidance, risk perceptions are treated as attitudes, not knowledge. We
therefore include two attitudinal indicators from ENIF (INEGI, 2022; 2025):
·
First, Risk_opportunity captures awareness of the trade‐off
between easy gains and losses. Specifically, Risk_opportunity is set to 1 if the respondent
affirms the statement “If someone offers you the chance to win money easily,
you can easily lose it too” (P4_7_2 = 1), and 0 otherwise.
·
Second, a variable labeled Risk_diversify
captures belief in diversification by coding as one respondent who agrees with “It's
better to save money in two or more ways or places than just one” (P4_7_3 =
1), and 0 otherwise.
In
subsequent analyses, both Risk_opportunity and
Risk_diversify enter as distinct predictors: the
former gauges sensitivity to potential losses associated with high‐return opportunities, whereas the latter
reflects a preference for spreading financial resources across multiple saving
channels. These attitudinal variables are not included in the Financial
Knowledge Index; under the OECD-INFE view they belong to the attitudes pillar,
and under the LM view they are distinct from factual knowledge.
Demographic and
Socioeconomic Controls
•
Age and Age Squared: (Allen et al.,
2016) (INEGI, 2025) Respondent’s age in
years (Courbage &
Nicolas, 2021); age_sq
= AGE² to capture nonlinear age effects.
•
Sex: (SEXO) (INEGI, 2022, 2025) Sex (0 = female;
1 = male).
·
Educational
attainment (NIV) (INEGI, 2022, 2025): was grouped into five levels: none,
elementary, middle school, high school, and higher education. For the
survey-weighted logistic regression, schooling enters as four dummies
(elementary, middle, high, higher), with no schooling as the omitted reference;
marginal effects are interpreted relative to this base. For machine-learning
models (Random Forest, XGBoost, LightGBM,
CatBoost), the same categories are encoded via
one-hot vectors to avoid imposing ordinality and to capture nonlinearities and
interactions. Responses of “don’t know/unstated” are set to missing. This
approach aligns the regression tables and ML features and replaces the
incorrect min–max “Scholar_norm” description.
·
Marital Status: (P3_2) (INEGI, 2022, 2025). Three dummies: MARRIED, where "Vive
con su pareja en unión libre" (“lives with their partner in a
common-law union) and "Está casada(o)"
(married) status were considered jointly;
SINGLE, for "Es soltera(o)"; and,
UNPARTNERED, for which "Está separada(o)"
(apart) , "Está divorciada(o)"
(divorced), and "Es viuda(o)"
(widow/widower) were considered in this category.
·
Labor‐Force Participation
(LFP) (P3_5) (INEGI, 2022, 2025): LFP = 1 if currently employed, self‐employed or searching for job; 0 if out of the
labor force such as students, retired or housewife.
·
Monthly Household Income (thousand Pesos):
Monthly household income was constructed from two ENIF items: the reported
earnings amount (P3_11A) and frequency of payment (P3_11B) (INEGI, 2022, 2025). Specifically, P3_11A records the respondent’s gross
earnings in pesos (ranging from 00000 = “No recibe ingresos” to 90000, with 98000 = “98 000 y más” and 99888 = “No responde”).
P3_11B indicates the payment interval (1 = semanal, 2
= quincenal, 3 = mensual, 4
= anual). To convert all observations into a common
monthly metric, the following algorithm was applied:
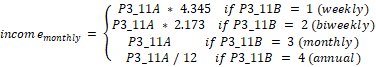
•
Observations coded P3_11A = 00000 (“no income”)
or P3_11A = 99888 (“no responde” no response) were
set to zero. The resulting income_monthly variable
(in pesos) was then rescaled to thousands of pesos (income_m_thous
= income_monthly / 1 000) to improve
interpretability. For inclusion in the machine-learning models, income_m_thous was normalized to the [0, 1] interval using
min‐max scaling:
![]()
This procedure ensured the comparability of
monthly income across all respondents, regardless of their original pay
frequency.
Behavioral/Infrastructural
Control
·
Cash usage index. This index is constructed from
two ENIF (INEGI, 2022, 2025) survey items: one for small purchases
(P7_1_1) and one for large purchases (P7_1_2).
For minor purchases,
the use of cash is coded 3, also for major purchases. For each good, a binary
indicator is formed, where 1 denotes the use of cash and 0 denotes the non-use.
Finally, the two
binary indicators are averaged to construct the Cash_usage_index,
ranging from 0 to 1. A value of 1 indicates using cash on big and small
purchases, while 0 indicates no cash usage. Intermediate values represent
partial use of cash. The index averages values from both responses and is used
in regression and machine-learning models to predict bank trust.
·
Digital access.
The digital access
variable measures respondents' accessibility to digital services, such as
owning a smartphone (P3_14) (INEGI, 2022, 2025), where a response of ‘yes’ is coded as 1 and ‘no’ is coded as 0. It also includes
Internet access in the household (P0_4_2) (INEGI, 2022, 2025), with ‘yes’ coded as 1 and ‘no’ coded as 0. The results are then
averaged from both responses and used to predict trust in banks through
regression and machine-learning models.
Financial-Infrastructure
and Regional Variables
We
include four state-level variables drawn from INEGI (INEGI, 2025)
banking-establishment and public-security databases:
State-Level Banking
Infrastructure:
·
ATM_number_norm is the number of
ATMs in respondent’s region (INEGI, 2022, 2025), normalized between [0,1].
·
Bank_branches_norm is the number of
bank branches in the respondent’s region (INEGI, 2022, 2025), normalized
between [0,1].
·
Estab_TPOS_norm is the number of establishments
with point-of-sale terminals in the respondent’s region (INEGI, 2022, 2025),
normalized between [0,1].
·
Security perception. Designated as the Safety_perception_index, this
variable assesses the population's perception of security within the
corresponding region. The data is from
the Encuesta Nacional de Victimización y
Percepción sobre Seguridad Pública (ENVIPE) (INEGI, 2021). Is an indicator of the percentage of Mexicans who feel
secure in their municipality, neighborhood, or house. This indicator is
constructed from INEGI's (2021, 2023) national household surveys
and represents insecurity perception and not a crime rate. The Regional
Security Perception Index was weighted by each state’s population for this
study. Subsequently, the Safety Perception Index was normalized using the
min-max method to obtain values ranging between 0 and 1.
Each respondent was assigned a value for these four
variables corresponding to their state of residence. In all regression and ML
models, these counts (and the index) are entered as continuous covariates,
capturing how regional banking infrastructure and security conditions shape
individual trust in banks.
Regional and Locality
Controls:
·
Locality size. Refers to the
population size of the respondent’s locality as identified by ENIF (INEGI,
2022, 2025). The categories were: 1 = 100,000 inhabitants or more; 2 = 15,000
to 99,999 inhabitants; 3 = 2,500 to 14,999 inhabitants; 4 = less than 2,500
inhabitants. This variable was coded as Locality_size_norm,
where the values are between 0 and 1, from normalization to the categories.
·
Region:
ENIF (INEGI, 2022, 2025) is divided into six geographic regions: 1 = Northwest,
2 = Northeast, 3 = Occident-Bajio, 4 = Mexico City, 5 = South Central-Orient; 6 = South.
These regions were coded as one-hot using dummy variables.
·
Year:
This is a binary variable that indicates the ENIF year, where 0 represents 2021
and 1 represents 2024.
Empirical
Strategy
The
empirical approach comprises two complementary techniques: (1)
logistic-regression models to estimate the marginal effects and statistical
significance of predictors on a binary trust outcome; and (2) tree-based machine-learning
(ML) algorithms, to capture nonlinearities and interactions while assessing
relative feature importance.
Dependent Variable Specification
Because the principal research question is
“Which factors predict TIB among Mexican adults?” we define a binary target as:
![]()
Logistic-Regression Model
We begin with a baseline logistic-regression
specification:
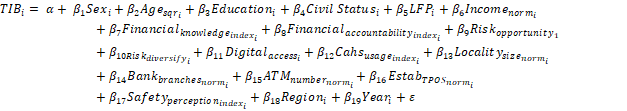
where:
·
Education was a dummy variable for elementary, middle
school, high school and higher. Edu_none (no education)
is omitted from the analysis.
·
Civil Status are dummy variables for Married_partnered and Unpartnered. Single
is omitted.
·
LFP is a dummy variable where 1 is a participant
and 0 is a non-participant.
·
Regions are dummies for regions 1–5 (Region 6 =
South is omitted).
Coefficients are
reported as average marginal effects (dy/dx) in the
sample means (Williams, 2012).
Multicollinearity
diagnostics
We evaluated for
multicollinearity by using variance inflation factors (VIF). The mean VIF was
2.64, with a small subset of expected temporospatial controls (year and
regional infrastructure variables) exhibiting higher values, all remaining
below conservative thresholds. (Salmerón et al.,
2020). In fact, these are manifestations of
expected temporospatial relationships, not a problem of linear dependence.
Thus, it is apparent that multicollinearity is not a problem that affects
stability and interpretation of coefficients. Also, multicollinearity is
largely a problem of parametric inference, and tree machine learning models
used in this analysis do not suffer from multicollinearity.
Machine-learning Models
This
study employs four tree-based machine-learning classifiers to model individual
trust in banks. In addition, a stacking ensemble is implemented as a
complementary approach to assess whether combining base learners improves
predictive performance. All features were provided to the machine-learning
pipeline as a pre-encoded matrix: categorical predictors were converted to
their numeric representations in advance, and continuous variables were normalized
with values between [0, 1]. Automated validation procedures systematically evaluate data for
out-of-range values, target imbalances, and feature-integrity concerns, thereby
ensuring high data quality prior to modeling.
Predictive
modeling leverages a sophisticated ensemble architecture comprising four
complementary base learners:
•
Random Forest for robust bagging (Mullainathan
& Spiess, 2017)
•
XGBoost for regularized
gradient boosting (Chen &
Guestrin, 2016)
•
LightGBM for
high-performance, leaf-wise boosting (Ke et al., 2017)
•
CatBoost for seamless
categorical handling (Prokhorenkova et
al., 2018)
Base‐model predictions are fused via a stacking
ensemble: a LightGBM meta-learner integrates the out-of-fold
predictions from each base learner. Stratified 5-fold cross-validation (Berrar, 2019) guides both
hyperparameter tuning and performance estimation, whereas sigmoid and isotonic
calibration refine the reliability of the predicted probabilities.
The
hyperparameter optimization is fully automated. An initial RandomizedSearchCV
phase quickly explores broad parameter ranges, after which Optuna
conducts multi-objective tuning while simultaneously optimizing the accuracy,
F1-score, and ROC-AUC. Memory‐management routines
dynamically monitor RAM usage and downcast data types where possible, thereby enabling
efficient training on large survey datasets.
Model
evaluation is comprehensive, encompassing:
•
Classification metrics (accuracy, precision,
recall, F1-score)
•
Ranking metrics (ROC-AUC, average precision)
•
Calibration metrics (log loss, reliability
diagrams)
This
is, model performance is evaluated using complementary metrics, including the
area under the receiver operating characteristic curve (ROC–AUC) and the
precision–recall area under the curve (PR–AUC). While ROC–AUC summarizes the
model’s ability to discriminate between outcomes across classification
thresholds, PR–AUC places greater emphasis on correct classification of the
positive class, which is particularly informative in settings with class
imbalance.
In
addition to individual classifiers, a stacking approach is employed. Stacking
is an ensemble-learning technique that combines the predictions of multiple
base models to generate a final prediction, potentially improving performance
by exploiting the strengths of different algorithms. All machine-learning
models used in this study are tree-based, meaning they rely on recursive
partitioning of the data and are well suited to capturing nonlinear
relationships and interaction effects.
Optimal
decision thresholds are identified via Youden’s J statistic, and a suite of
visual diagnostics—ROC and precision-recall curves, feature‐importance bar plots, and correlation
heatmaps—facilitates transparent comparison across models.
To
elucidate the drivers of banking trust, the pipeline integrates
interpretable-ML techniques. SHAP (Lundberg &
Lee, 2017) provides local and
global explanations using TreeExplainer, LinearExplainer, and KernelExplainer,
generating interactive force, dependence, and summary plots. Permutation‐importance analyses and model‐specific feature rankings were further
accompanied by statistical significance testing to confirm the robustness of the
identified predictors.
Statistical
validity was ensured by the following:
•
Variance Inflation Factor analyses to detect
multicollinearity
•
Parametric coefficient estimation for
interpretable effect sizes
•
Confidence intervals around predicted
probabilities
•
Model diagnostics, including residual analysis
and goodness-of-fit tests
Inference and robustness
considerations
Statistical inference, including
standard errors and confidence intervals, is conducted within the logistic
regression framework, where coefficient estimation and hypothesis testing are
well defined. In contrast, the primary objective of the machine-learning models
is predictive performance rather than parameter inference. Accordingly,
robustness in the machine-learning context is assessed through out-of-sample
validation and performance stability across alternative algorithms and metrics.
Specifically, model performance is evaluated using
cross-validation procedures and complementary metrics such as ROC–AUC and
precision–recall AUC. Consistent results across models provide evidence of
robustness to model specification and sample variation. This combined approach
allows the analysis to benefit from formal statistical inference in the
econometric model while exploiting the flexibility of machine-learning methods
to capture nonlinearities and heterogeneous effects.
Results
Logistic Regression Results
Survey‐weighted logistic regression was used to
identify the individual-level determinants of TIB = 1). The estimation sample
included 27,056 respondents (design degrees of freedom = 2,171), representing a
population per year as shown in Table 1, of:
Table 1
Population representation
ENIF 2021, 2024
|
Year |
Population |
|
2021 |
90,328,320 |
|
2024 |
94,221,441 |
|
Total |
184,549,761 |
Source: Authors’ elaboration with data from INEGI (2021, 2025)
The
overall model was highly significant (F (27, 2145) = 41.92, p < .001).
Tables 2 and 3 present the full coefficient estimates and average marginal
effects, respectively.
The analysis of marginal effects (dy/dx) revealed several salient factors that influence
individuals’ trust in banks. Notably, the squared term for age demonstrated
that as respondents’ ages increased to higher extremes, the probability of
reporting trust in banks decreased substantially -25.8 pp. Educational
attainment emerged as a significant predictor, with completion of secondary
education associated with a +7.4 pp, and higher education yielding a comparable
effect +7.2 pp, relative to those without formal education.
Household income, measured as a one-unit
increase in normalized income, was robustly associated with greater trust in
banks (+58.8 pp). Financial knowledge (+19.4 pp) and financial accountability (+13.3
pp) were also strong positive determinants. In terms of access to financial
services, greater digital accessibility corresponded to a 7.5 pp increase in
trust, whereas higher dependence on cash (-4.5 pp) and residency in smaller
urban localities (-3.5 pp) were associated with lower trust levels.
Table 2
Logistic regression coefficients
|
TIB |
Coefficient |
Std. Err. |
P>t |
|
Sex |
0.0153181 |
0.0432281 |
0.723 |
|
Age_sqr |
-1.1799730*** |
0.1372356 |
0.000 |
|
Elementary |
-0.0664667 |
0.0610764 |
0.277 |
|
Middle school |
0.1385063 |
0.0730802 |
0.058 |
|
Highschool |
0.3381847*** |
0.068433 |
0.000 |
|
Higher |
0.3308259*** |
0.0749043 |
0.000 |
|
Married_partnered |
-0.1403426** |
0.0518044 |
0.007 |
|
Unpartnered |
-0.0900615 |
0.0685769 |
0.189 |
|
LFP |
-0.1083240* |
0.051841 |
0.037 |
|
Income_norm |
2.6875290*** |
0.4314828 |
0.000 |
|
Financial_knowledge_index |
0.8873147*** |
0.1529521 |
0.000 |
|
Financial_accountability_index |
0.6079980*** |
0.0823243 |
0.000 |
|
Risk_opportunity |
0.1739683*** |
0.0442976 |
0.000 |
|
Risk_diversify |
0.2363627*** |
0.0446844 |
0.000 |
|
Digital_access |
0.3434786*** |
0.0697817 |
0.000 |
|
Cash_usage_index |
-0.2045666** |
0.0761589 |
0.007 |
|
Locality_size_norm |
-0.1578039** |
0.0600514 |
0.009 |
|
Bank_branches_norm |
2.4021510* |
1.15286 |
0.037 |
|
ATM_number_norm |
-5.4898470* |
2.630328 |
0.037 |
|
Estab_TPOS_norm |
3.9191910* |
1.789483 |
0.029 |
|
Safety_perception_index |
2.6854610*** |
0.7285679 |
0.000 |
|
Region_Northwest |
1.2151530** |
0.3884239 |
0.002 |
|
Region_Northeast |
2.5338500* |
0.9912105 |
0.011 |
|
Region_Occident_Bajio |
-1.1799070* |
0.4874668 |
0.016 |
|
Region_Mexico_City |
2.1992760** |
0.6555795 |
0.001 |
|
Region_CentralSouth_Orient |
-0.3814723* |
0.1557763 |
0.014 |
|
Year |
0.1022517 |
0.1949696 |
0.600 |
|
_cons |
-2.8954170*** |
0.8024116 |
0.000 |
Survey-weighted average marginal effects; robust
standard errors clustered at PSU; weights = FAC_PER; strata = EST_DIS; PSU =
UPM_DIS
*** p<.001, ** p<.01, * p<.05
Source: Own calculations based on INEGI (2020–2025)
Table 3
Marginal effects
|
dy/dx |
std. err. |
P>t |
|
|
Sex |
0.0033531 |
0.0094619 |
0.723 |
|
Age_sqr |
-0.2582902*** |
0.0298098 |
0.000 |
|
Elementary |
-0.0145492 |
0.0133679 |
0.277 |
|
Middle school |
0.0303183 |
0.0159884 |
0.058 |
|
Highschool |
0.0740269*** |
0.0148813 |
0.000 |
|
Higher |
0.0724161*** |
0.0163479 |
0.000 |
|
Married_partnered |
-0.0307203** |
0.0113132 |
0.007 |
|
Unpartnered |
-0.019714 |
0.0150006 |
0.189 |
|
LFP |
-0.0237116* |
0.0113534 |
0.037 |
|
Income_norm |
0.5882865*** |
0.0940043 |
0.000 |
|
Financial_knowledge_index |
0.1942287*** |
0.0333362 |
0.000 |
|
Financial_accountability_index |
0.1330877*** |
0.0178853 |
0.000 |
|
Risk_opportunity |
0.0380808*** |
0.0096809 |
0.000 |
|
Risk_diversify |
0.0517386*** |
0.009731 |
0.000 |
|
Digital_access |
0.0751857*** |
0.0152294 |
0.000 |
|
Cash_usage_index |
-0.0447786** |
0.016667 |
0.007 |
|
Locality_size_norm |
-0.0345425** |
0.0131446 |
0.009 |
|
Bank_branches_norm |
0.5258187* |
0.2522871 |
0.037 |
|
ATM_number_norm |
-1.2017000* |
0.5756083 |
0.037 |
|
Estab_TPOS_norm |
0.8578912* |
0.3916022 |
0.029 |
|
Safety_perception_index |
0.5878338*** |
0.1593508 |
0.000 |
|
Region_Northwest |
0.2659908** |
0.0849523 |
0.002 |
|
Region_Northeast |
0.5546470* |
0.2168825 |
0.011 |
|
Region_Occident_Bajio |
-0.2582758* |
0.106701 |
0.016 |
|
Region_Mexico_City |
0.4814105** |
0.1433888 |
0.001 |
|
Region_CentralSouth_Orient |
-0.0835024* |
0.0341324 |
0.015 |
|
Year |
0.0223824 |
0.0426762 |
0.600 |
Survey-weighted average marginal effects; robust
standard errors clustered at PSU; weights = FAC_PER; strata = EST_DIS; PSU =
UPM_DIS
*** p<.001, ** p<.01, * p<.05
Source: Authors’ own calculations based on INEGI
(2020–2025)
Regarding institutional
infrastructure, a one-unit increase in the density of bank branches was
positively related to trust (+52.6 pp), whereas a similar increase in ATM
availability exhibited a negative association (-120.2 pp). The presence of
point-of-sale (POS) terminals was also positively associated with trust in
banks (+85.8 pp).
Perceptions of safety within the
banking environment also contributed substantially; a one-unit increase in
perceived safety resulted in a +58.8 pp increase in trust. Attitudinal factors,
such as risk tolerance measured by opportunity-seeking (+3.8 pp) and
diversification preferences (+5.2 pp), were both significantly positively
correlated.
With respect to sociodemographic
characteristics, being married (-3.1 pp) and participation in the labor force (-2.4
pp) were marginally associated with reduced trust. Regional heterogeneity was
evident: compared to the reference region, respondents in the Northeast (+55.5
pp) and Mexico City (+48.1 pp) exhibited greater trust in banks, whereas those
in the Occident‐Bajio
(-25.8 pp) and Central‐South‐Orient (-8.4 pp) regions reported lower levels of
trust.
The goodness‐of‐fit
test for the survey‐weighted
logistic model yielded the following:
F (9, 2163) = 2.26, p = 0.0164.
Under the null hypothesis, the
model is correctly specified, and its predicted probabilities do not
systematically differ from the observed outcomes. We reject this null
hypothesis because p<0.05, indicating that there remains a statistically
significant lack of fit even after accounting for our 27 predictors and survey
design. Therefore, it is necessary to utilize machine-learning models, which
are designed to capture complex nonlinearities and interactions, as a
complementary approach to uncover patterns that the logistic model may not
detect.
Machine‐Learning Results
Because TIB = 1 constitutes the majority class in our
hold-out sample (16 338/27 056 ≈ 60.39 %), the baseline precision in a
Precision–Recall framework is 0.6039,
not “near zero.” In other words, a naïve classifier that randomly labels
observations as “trust” with the same frequency as in the data would achieve an
average precision of 0.6039. Therefore, we assessed our models’ lift over the baseline when reporting the PR-AUC (Saito & Rehmsmeier, 2015).
Table 4 reports the performance of the four
machine-learning classifiers and the stacking ensemble, benchmarked against a
random baseline. A baseline precision of 0.6039 reflects at 60.39 % prevalence
of TIB = 1 in the hold-out set, indicating that a random classifier would
correctly flag trusting respondents only at that rate. Among the algorithms, CatBoost attained the highest PR-AUC (0.7339) and the
strongest ROC-AUC (0.6634), along with low log-loss (0.6503) and narrowly
outperforming RandomForest (PR-AUC = 0.7317; ROC-AUC = 0.6617; log-loss =
0.6526). However, RandomForest was ultimately preferred owing to its superior
probability calibration and lower variance in log-loss across cross-validation
folds. XGBoost and LightGBM
delivered nearly identical discrimination (PR-AUC ≃ 0.731; ROC-AUC ≃ 0.662), underscoring the robustness of tree-based
ensembles, whereas the stacking ensemble underperformed (PR-AUC = 0.7233;
ROC-AUC = 0.6492), suggesting limited incremental benefit from combining these
models.
Table 4
Classifier results comparison: four base
learners and one stacking ensemble
|
Model / Baseline |
PR-AUC |
ROC-AUC |
Log-loss |
Opt. Threshold |
Accuracy |
Precision |
Recall |
F₁ |
|
Baseline
(random) |
0.6039 |
– |
– |
– |
– |
– |
– |
– |
|
RandomForest |
0.7317 |
0.6617 |
0.6526 |
0.5262 |
0.6114 |
0.7226 |
0.5786 |
0.6427 |
|
XGBoost |
0.7315 |
0.6613 |
0.6473 |
– |
0.6216 |
0.7111 |
0.6288 |
0.6674 |
|
LightGBM |
0.7309 |
0.6614 |
0.6427 |
0.5151 |
0.6353 |
0.7001 |
0.6928 |
0.6964 |
|
CatBoost (best
single model) |
0.7339 |
0.6634 |
0.6503 |
0.4942 |
0.6310 |
0.7056 |
0.6674 |
0.6860 |
|
Stacking
Ensemble |
0.7233 |
0.6492 |
0.6371 |
0.6199 |
0.6035 |
0.7049 |
0.5906 |
0.6427 |
Source: Authors’ calculations using ENIF 2021 (INEGI, 2022) and ENIF 2024 (INEGI, 2025)
Feature importance
The feature-importance chart
(Figure 1) ranks each predictor by how much it reduces impurity (or “gain”)
across all trees in the best single model.
To investigate the determinants
of model performance, several key patterns emerge from the feature importance
analysis. The most important predictor is the squared age variable (Age_sqr), which has an importance
value of almost 140. This result shows the strong nonlinear relation of age to
trust: Trust levels are maximized in mid-adult life, with a sharp decrease when
age is either low or high.
Figure 1
Feature selection importance
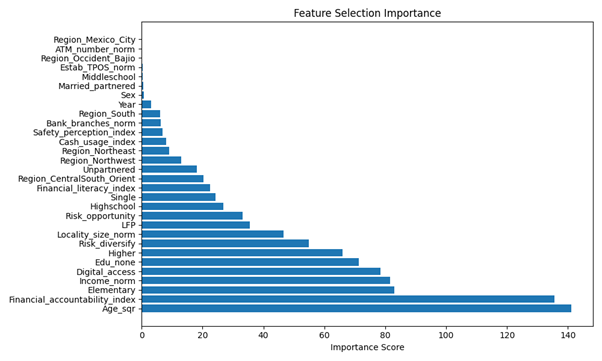
Source: Authors’ elaboration using data from INEGI (INEGI, 2020)
Financial Accountability Index
reaches an importance measure of over 130. This
underscores the primary value of individuals’
perceived financial capability and reports an attitudinal measure second only
to age in terms of predictive power. Socioeconomic status and access to major
resources variables formed the subsequent level of predictive variables, whose
importance measures usually resided in the 70–90 interval. This list consisted
of education attainment (eminently so at ‘none’ and at the elementary level),
normalized household income (Income_norm), and access
to computers (digital access). Higher education is another feature of this
area. Overall, these results indicate the primary role education, income, and digital
access play in discriminating between those who reported trusting and those who
did not.
A second group of predictors,
with mid-level importance values between 40 and 65, consists of attitudinal and
contextual factors like risk preferences (Risk_diversify
and Risk_opportunity), locality size (Locality_size_norm), participation in the labor force
(LFP), and the Financial Knowledge Index. These factors have a significant
impact on trust predicted, although their relative
strength is moderate when we consider the stronger socioeconomic drivers. Finally, demographic and infrastructural variables, such
as sex, marital status, regional indicators, ATM density, and POS‐terminal density had the lowest importance scores
(below 30). These findings suggest that, once the principal attitudinal and
structural factors are accounted for, such demographic and infrastructural
characteristics contribute only marginal predictive value to the model.
Overall, the ranking confirms
that demographic nonlinearity (Courbage & Nicolas, 2021) and financial attitudes (accountability and
knowledge) are the engines of the model, while basic socioeconomic status and
digital access further sharpen its discrimination, and purely geographic or
infrastructural measures play only a minor role.
Synthesis and Comparison
Both approaches converge on the
centrality of socioeconomic status and financial attitudes for TIB: household
income, financial accountability, and digital access consistently rank among
the top predictors in the logistic and ML models. They also agree that
risk-diversification attitudes and digital engagement are positively associated
with trust. Where they differ is informative: ML surfaces a pronounced nonlinear
age profile—captured by the squared term (Age_sqr)—with
trust peaking in mid-adulthood and tapering at younger and older ages; the
logistic model flags Age_sqr as significant but less
richly. ML further elevates the role of basic educational attainment,
suggesting interactions and multi-path mechanisms that parametric models may
understate. By contrast, regional indicators are significant in the logistic
regressions but fall in ML importance rankings, likely because tree-based
ensembles absorb spatial heterogeneity through finer individual-level features.
Taken together, the methods are complementary. Both
identify shared foundations—financial capability and access—while ML adds value
by revealing nonlinearities and interactions that standard specifications
obscure. The emerging narrative is that trust in banks is anchored in material
and perceptual access to financial resources, yet the pathways that build trust
are multidimensional and context-sensitive.
Discussion
Key Findings
This study employs
both survey‐weighted logistic
regression and tree‐based machine‐learning (ML) models to identify the key
determinants of TIB among Mexican adults.
Both approaches converged on the centrality of socioeconomic status and
financial‐attitudinal
factors—household income, financial accountability, and digital access emerged
as the top predictors of depositor confidence.
The enhanced ML pipeline further uncovered a pronounced nonlinear age
effect: trust peaked in mid-adulthood and declined at both younger and older
extremes. Educational attainment, especially
the distinction between no formal education and elementary level, also
exhibited heightened importance in ML models, suggesting multidimensional
pathways linking basic schooling to trust that are not fully captured by
parametric methods.
Geographic
dummies, while significant in the logistic framework, played only a minor role
in the ML ranking, implying that ensemble methods internalize spatial
heterogeneity through more granular individual predictors. Finally, attitudinal measures of risk
diversification and engagement with digital financial services positively
contribute to trust, underscoring the interplay between risk orientation and
fintech adoption.
At the algorithmic
level, CatBoost attained the highest discrimination
(PR-AUC = 0.7339; ROC-AUC = 0.6634) before calibration and narrowly outperformed
RandomForest. However, Random Forest’s
superior probability calibration and lower log-loss variance recommended it for
policy‐relevant
applications. The feature‐importance analysis of the best single model
highlighted Age_sqr (≈ 140) and the Financial
Accountability Index (≈ 130) as the dominant drivers of predictive performance,
followed by education, normalized income, and digital access (importance scores
of 70–90). Mid-range factors (scores
~40–65) included perceived neighborhood security, risk attitudes, locality
size, labor-force participation, and financial knowledge, while purely
demographic or infrastructural variables (sex, marital status, regional
indicators, ATM/POS density) contributed marginally.
Comparison with Prior Literature
These
findings corroborate theoretical accounts that emphasize the joint role of
structural assurances (e.g., deposit insurance and regulatory quality) and
individual capabilities (financial knowledge and accountability) in fostering
institutional trust (Mayer, Davis, & Schoorman, 2006;
Zucker, 1986). The nonlinear age pattern we uncover is consistent with
life-cycle effects on financial behavior (Courbage
& Nicolas, 2021). The pronounced role of digital access accords with
evidence that improvements in digital payments can elevate trust in banks’
services (Bijlsma
et al., 2022) and with systematic
reviews highlighting trust and security as central to FinTech adoption (Jafri
et al., 2024). At the same time, the literature cautions that mere uptake
without credible security and usability gains may not raise trust—an
observation aligned with our result that digital access matters most when
paired with favorable security perceptions (del
Carmen Díaz-Peña et al., 2025).
Our comparatively
smaller effects for ATM/POS density relative to
digital access are compatible with work showing that branches often function as
“symbols of trust,” whose marginal salience can diminish as digital channels expand and service reliability is signaled through other
means (Sakong & Zentefis, 2024). The positive
income gradient and the mixed, life-cycle-shaped patterns for education and age
fall within the ranges documented in cross-country analyses of trust in banks
and in recent European evidence on trust in payment services (Fungáčová
et al., 2019). Finally, the
positive association between perceived neighborhood security and TIB echoes
Mexico-specific findings that crime and insecurity depress institutional trust (Blanco,
2013). Our findings show that in Mexico, digital
access, safety perceptions, and visible infrastructure together influence trust
in banks.
Limitations
There are several
caveats that warrant consideration.
First, the survey‐weighted logistic
model exhibited a statistically significant lack of fit (F(9,2163)=2.26, p=0.0164), implying that complex nonlinearities
remain unmodeled by parametric approaches.
Second, the cross-sectional design of the ENIF waves limits causal
inference and may be subject to reporting bias.
Third, national‐level financial
indicators (e.g., deposit/GDP) were not directly linked in the individual‐level analysis; future work could integrate
macro‐micro models to
strengthen external validity.
Conclusion
This study illustrates that TIB of Mexican adults has
a confluence of socioeconomic status, financial-behavioral practices, and
digital experiences. Household income and financial responsibility emerge as
among the very best predictors of TIB in survey-weighted logistic regression
and machine-learning models, and the nonlinear life-cycle pattern—reaching its
maximum at mid-life and declining at young and oldest ages—emerges most clearly
for tree-based learners. Lower levels of education
appear more significant within non-parametric analyses, which aligns with the
notion that schooling may influence trust through multiple channels.
Furthermore, digital access indicators and diversification attitudes
demonstrate that both secure engagement with fintech and prudent financial
behavior play central roles in supporting trust. From a methodological
perspective, ensemble learning algorithms such as CatBoost
and Random Forest demonstrate superior discriminatory ability (PR-AUC ≈ 0.73)
and enhance diagnostic feature analysis. These findings suggest that machine
learning approaches can effectively complement and extend traditional
econometric inference methods.
They imply three
practical levers for regulators and institutions: establish stronger
financial-capability programs—with emphasis on accountability practices and
core education—so confidence grows at scale; install safe and equitable digital
infrastructure and digital literacy, with tailored assistance for young and old
adults with particular barriers to online banking; and transmit service
reliability and consumer protections so that trust cues are salient. These
types of initiatives can augment personal confidence and, as a side effect,
support further macro objectives such as increasing
the bank-deposit/GDP ratio and sustaining inclusive growth. Because the design
is cross-sectional, causal inference is limited. A natural next step is
panel-based machine-learning with macro/financial shocks to trace trust
trajectories over time (Knell & Stix, 2015; Butzbach, 2016), interpret
model-based importances/SHAP patterns with formal theories of trust for sharper
mechanisms (Sztompka, 1999), and apply natural experiments—like deposit-insurance
reforms—to estimate impacts of policies. Including explicit macro–micro
linkages between aggregate financial indicators and trusting individuals would
further improve external validity. In combination, predictive analytics and
evaluation driven by theory offer practical guidance for bolstering trust and
inclusion in Mexico’s banking system.
Bibliographic References
Adamyk, B., Skirka, A., Snihur, K., & Adamyk, O.
(2019). Analysis of Trust in Ukrainian banks based on machine learning
algorithms.
Ahmad,
S., Hussain, F. Z., Naheed, K., & Shahid, M. S. (2021). An Empirical
Investigation of E-banking Service Quality Customer Trust and Customer Loyalty
of Pakistani Banks. Sustainable Business
and Society in Emerging Economies, 3(3),
319-326.
Allen,
F., Demirguc-Kunt, A., Klapper, L., & Martinez
Peria, M. S. (2016). The foundations of financial inclusion: Understanding
ownership and use of formal accounts. Journal
of Financial Intermediation, 27,
1-30. https://doi.org/https://doi.org/10.1016/j.jfi.2015.12.003
Alraheb, T.
H., Nicolas, C., & Tarazi, A. (2019). Institutional environment and bank capital ratios. Journal of Financial Stability, 43, 1-24.
Atkinson,
A., & Messy, F.-A. (2012). Measuring financial literacy: Results of the
OECD/International Network on Financial Education (INFE) pilot study.
Berrar, D. (2019). Cross-validation. In M. Rehm & S.
König-Ries (Eds.), Encyclopedia of
Bioinformatics and Computational Biology (pp. 542-545). Elsevier.
Bijlsma,
M., van der Cruijsen, C., & Koldijk, J. (2022).
Determinants of trust in banks’ payment services during COVID: An exploration
using daily data. De Economist, 170(2), 231-256.
Blanco,
L. R. (2013). The impact of crime on trust in institutions in Mexico. European Journal of Political Economy, 32, 38-55.
Broekhoff,
M.-C., van der Cruijsen, C., & de Haan, J. (2024). Towards financial
inclusion: Trust in banks payment services among groups at risk. Economic Analysis and Policy, 82, 104-123. https://doi.org/10.1016/j.eap.2024.02.038
Butzbach,
O. (2016). Trust in banks: a tentative conceptual framework. Journal of Contextual Economics–Schmollers Jahrbuch(3), 303-330.
Chen,
T., & Guestrin, C. (2016). XGBoost:
A scalable tree boosting system. Proceedings of the 22nd ACM SIGKDD
International Conference on Knowledge Discovery and Data Mining, New York, NY.
Courbage, C., & Nicolas, C. (2021). Trust in insurance:
The importance of experiences. Journal
of risk and insurance, 88(2),
263-291.
del
Carmen Díaz-Peña, L., Sosa, F. A. P., Robles, R. D., & Sauza, R. M.
(2025). The Service-Dominant Logic as driver of financial inclusion in digital
payments sector: The case of E-fectivo. Revista Mexicana de Economía y Finanzas
Nueva Época REMEF, 20(4).
Fungáčová, Z., Hasan, I.,
& Weill, L. (2019). Trust
in banks. Journal of Economic Behavior
& Organization, 157,
452-476. https://doi.org/10.1016/j.jebo.2017.08.014
Hu,
Z., Ding, S., Li, S., Chen, L., & Yang, S. (2019). Adoption
intention of fintech services for bank users: An empirical examination
with an extended technology acceptance model. Symmetry, 11(3), 340.
INEGI. (2020). Census of Population and Housing 2020
(Censo de Población y Vivienda 2020) (
INEGI. (2021). Encuesta Nacional de Victimización y
Percepción sobre Seguridad Pública (ENVIPE) 2021 (
INEGI. (2022). Encuesta Nacional de Inclusión Financiera
(ENIF) 2021: Metodología.
INEGI. (2025). Encuesta Nacional de Inclusión Financiera
(ENIF) 2024: Metodología y resultados.
Jafri,
J. A., Amin, S. I. M., Rahman, A. A., & Nor, S. M. (2024). A systematic
literature review of the role of trust and security on Fintech adoption in
banking. Heliyon, 10(1).
Ke,
G., Meng, Q., Finley, T., Wang, T., Chen, W., Ma, W.,…Liu,
T.-Y. (2017). Lightgbm: A highly efficient gradient
boosting decision tree. Advances in
neural information processing systems,
30.
Knack,
S., & Zak, P. J. (2003). Building trust: public policy, interpersonal
trust, and economic development. Supreme
court economic review, 10,
91-107.
Knell,
M., & Stix, H. (2015). Trust in banks during normal and crisis
times—evidence from survey data. Economica, 82, 995-1020.
Koomson,
I., Koomson, P., & Abdul-Mumuni, A. (2023). Trust in banks, financial
inclusion and the mediating role of borrower discouragement. International Review of Economics &
Finance, 88, 1418-1431. https://doi.org/10.1016/j.iref.2023.07.090
Luhmann,
N. (2018). Trust and power. John
Wiley & Sons.
Lundberg,
S. M., & Lee, S. I. (2017). A unified approach to interpreting model
predictions. Advances in Neural Information Processing Systems 30, Long Beach,
CA.
Lusardi,
A., & Mitchell, O. S. (2011). Financial literacy and retirement planning
in the United States. Journal of pension
economics & finance, 10(4),
509-525.
Mayer,
R. C., Davis, J. H., & Schoorman, F. D. (2006).
An Integrative Model of Organizational Trust. In Organizational Trust (pp. 82-108): Oxford University PressOxford.
Mullainathan,
S., & Spiess, J. (2017). Machine learning: an applied econometric
approach. Journal of economic
perspectives, 31(2), 87-106.
Prokhorenkova, L., Gusev, G., Vorobev, A., Dorogush,
A. V., & Gulin, A. (2018). CatBoost: unbiased
boosting with categorical features. Advances
in neural information processing systems, 31.
Saito,
T., & Rehmsmeier, M. (2015). The
precision-recall plot is more informative than the ROC plot when evaluating
binary classifiers on imbalanced datasets. PloS one, 10(3), e0118432.
Sakong,
J., & Zentefis, A. (2024). Bank branch access:
Evidence from geolocation data. Olin
Business School Center for Finance & Accounting Research Paper(2023/12).
Salazar-Cruz,
L. M., & Román-Reyes, P. (2015). Continuities and changes in labor
participation in the State of Mexico during 2000-2012 period [Article]. Papeles de Poblacion, 21(83), 135-188.
Salmerón, R., García, C., & García, J. (2020). Overcoming
the inconsistences of the variance inflation factor: A redefined VIF and a
test to detect statistical troubling multicollinearity. arXiv preprint arXiv:2005.02245.
Sztompka, P. (1999). Trust:
A sociological theory. Cambridge University
Press.
van der
Cruijsen, C., de Haan, J., & Roerink,
R. (2021). Financial knowledge
and trust in financial institutions. Journal
of Consumer Affairs, 55(2),
680-714.
Williams,
R. (2012). Using the margins command to estimate and interpret adjusted
predictions and marginal effects. The
Stata Journal, 12(2), 308-331.
Zucker,
L. G. (1986). Production of trust: Institutional sources of economic
structure, 1840–1920. Research in organizational
behavior.